Welcome back to the Lab! Today we’re going to talk about how we use all of the information we gathered during the cataloging process to further understand the site. There are a variety of analytical methods we use with a variety of artifacts to help us paint a picture of the site inhabitants and the world they occupy. Warning… here there be math!
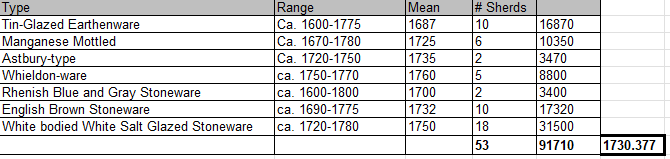
One of the first things we want to know about an artifact assemblage is how old it is. We do this by examining diagnostic artifacts, a term archaeologists use to describe artifacts that are known to come from a particular time period. As ceramics are usually the most numerous, diagnostic artifact present on historic sites, calculating a Mean Ceramic Date (or MCD) can help us determine a likely occupation date of the site. To calculate the MCD, we take the total number of each type of ceramic and multiply it by the mean production date of the ceramic type. We then calculate the total of those numbers, divide it by the total number of sherds, and voila!
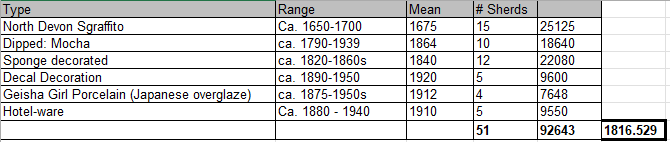
As you can see in the example above, this method works best when of the recovered ceramics are from the same general time period (which is rare). It is less accurate if you have outliers caused by either stratigraphic disturbance, hand-me-downs, or heirlooming. In the example below, you can see how one possibly heirloomed plate broken by a pesky toddler (we assume) can significantly skew the MCD. The mean date for everything but the Sgraffito sherds is mid-nineteenth century or later, but the introduction of those 15 early sherds, which all come from the same single plate, brings the MCD down to 1816. If we take those out, the MCD would be fall in a tighter time frame, which probably gives us a more accurate picture of when this site was occupied.
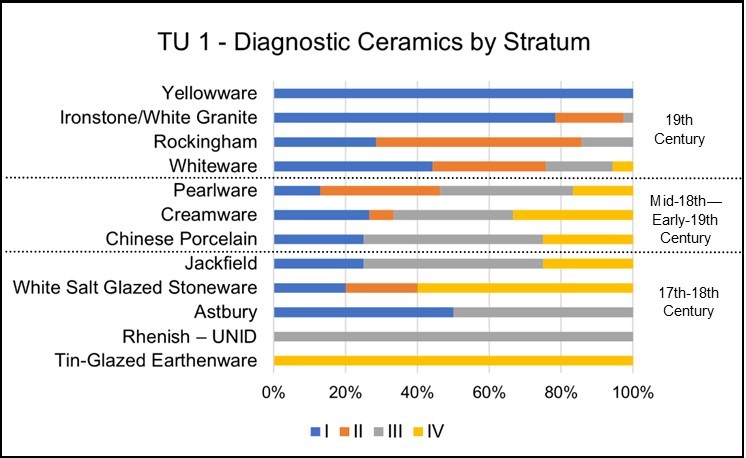
You can determine the MCD across the site vertically or horizontally. In a recent excavation, we looked at historic ceramics within one excavation unit and compared the percentages of each type within each stratum. While some mixing was evident, you can see that the older ceramic types were more prevalent in the lower strata.
All analytical methods have their drawbacks which is why we try to use several during analysis. Another ceramic analysis method is the Minimum Number of Vessels (or MNV). This counts the number of unique ceramic sherds in a collection. While we do record artifact counts, they have limited analysis benefits. A plate can break into 2 pieces or 2000 pieces. But if we have 200 sherds of edged-decorated refined earthenware and we can determine that there are at least 14 different rim decorations, then we know we have at minimum, 14 different vessels.
If we have two of the exact same bone, from the same side of the same animal, we can surmise that there were at least two of those animals at the site, which is an analytical method we call the Minimum Number of Individuals (MNI).
Distribution maps help show the distribution of artifacts across the site horizontally. Distribution maps are extremely informative and can be used to show the spread of a single artifact type (quartz debitage) or an artifact subclass (historic ceramics). These are particularly helpful in identifying activity areas or the locations of former structures or trash pits. A concentration of kitchen refuse along the wall of a dwelling can indicate the potential location of a door or window where garbage was swept or tossed. Concentrations of nails and architectural hardware without any domestic items could indicate a work shed or other outbuilding. Clusters of utilitarian ceramic and glassware could indicate a kitchen. Concentrations of lithic debitage can indicate a tool processing area.
These are just some of the analytical methods we use to understand an artifact assemblage. New methods and revisions to old methods are constantly emerging as technology and research improve. Next post is the final piece of the puzzle: Curation!